Enhancing
Deliberation Through Computer Supported Argument
Visualization
Tim van Gelder
Department
of Philosophy; University of Melbourne, Australia; and Austhink
5.1 Introduction
As this is
being written, the Governor General of Australia, Dr. Peter Hollingworth,
has not resigned. Yet over the previous weeks and months he must have been
thinking about it long and hard. He has been under intense pressure from
various quarters, based on allegations that in previous positions of leadership
he had not handled some sexual abuse incidents appropriately. In pondering what
he should do, he must have been considering the many and varied arguments on
both sides of the case. He must, in short, have been deliberating about
his future.
Deliberation is a form of thinking
in which we decide where we stand on some claim in light of the relevant
arguments. It is common and important, whether in our personal, public or
working lives. It is also complicated, difficult and usually poorly done.
This chapter contends that
deliberation can be improved by visualization of the arguments, especially when
the visualization is supported by newly-available computer tools. This point is
supported in two ways. First, the chapter describes how computer supported
argument visualization contributes to gains in general reasoning skills among
undergraduate students. Second, it describes how real-time computer supported
argument visualization can facilitate group deliberation in the workplace. The
case studies are preceded by some clarification and discussion of the key
concepts of deliberation and argument visualization, and of the relationship
between argument visualization and prose.
5.1.1 What is Deliberation?
Deliberation, as the term is used here, is a
process aimed at deciding whether some claim ought to be believed by
considering the relevant arguments.[1] The claim might describe what
one should do (i.e., be of the form We
should do X) and so deliberation can be directed towards action as well as
belief. The arguments considered will invoke further claims, and in some cases
their truth must also be determined through deliberation; and so on. Thus
deliberation often involves considering an extended hierarchy of arguments.
Deliberation
is not the same as reasoning. Reasoning is tracing the web of inferential
relationships among propositions; this can be done without intending to
determine whether any particular proposition is true. For example, from All
As are Bs and All Bs
are Cs you can infer All As are Cs without caring whether any of
these are true or even what they mean. This is reasoning but not deliberating.
Deliberation obviously involves reasoning, however; indeed, reasoning is the
means by which one deliberates. If reasoning is like running, then deliberation
is like running to catch a bus or to win a race.
Deliberation also differs subtly
from argumentation. The latter is defined by van Eemeren
et al. As
a verbal and social activity of reason aimed at
increasing (or decreasing) the acceptability of a controversial standpoint for
the listener or reader, by putting forward a constellation of propositions
intended to justify (or refute) the standpoint before a rational judge. (van Eemeren at al., 1996, p.5)
and on
this account, at least, involves rational persuasion: the point of
argumentation is to influence others’ attitudes by means of arguments.
Deliberation, by contrast, is aimed at determining one’s own attitude.
Deliberation
is often, like argumentation, a collective activity. For example a group of
friends may deliberate over which restaurant is best, or a group of historians
may deliberate to determine whether the treatment of indigenous Australians by
European settlers merits the term “genocide”.
These forms of deliberation essentially involve both reasoning and
argumentation.
5.2 What is Argument Visualization?
An argument visualization is a presentation of
reasoning in which the evidential relationships among claims are made wholly
explicit using graphical or other non-verbal techniques. Argument visualization
is producing such visual techniques.
All
reasoning involves propositions standing in logical or evidential relationships
with each other, and thus forming evidential structures. In any given case this
“constellation of propositions” must be expressed or presented in some way in
order to be comprehended or communicated. Overwhelmingly, this is done in
prose, whether spoken or written. Argument visualizations can thus be seen as
alternatives to prose as vehicles for presenting arguments.
To illustrate: consider the
following piece of prose:
Very few scientists have spent much
time thinking about the end of the world, and those few have reached diverse
conclusions. All scenarios for the end of the world are highly speculative.
They cannot be tested or verified by observation or experiment. The
beginning of the world in the colossal explosion that we call the Big Bang has
left many physical traces that can be observed and analyzed. The science of
cosmology is largely concerned with collecting tangible evidence of things that
happened billions of years ago, going all the way back to the beginning. No
such tangible evidence can exist for the ending. For this reason, most
scientists consider that the end of the world does not have much to do with
science (Dyson, 2002)
This
passage presents some reasoning; the reasoning involves various propositions
concerning matters such as science, observation, and the end of the universe.
The propositions are listed in the text; part of the hermeneutic challenge for
the reader is to figure out their evidential relationships to each other.
Here
is similar reasoning, presented as a visualization:
This
uses some simple visualization conventions: the main conclusion is written in a
white, square box at the top, and grey rounded boxes contain reasons; the
arrows indicate the relations of supposed evidential support.
Note
that it is not clear that the reasoning presented by the visualization is
identical to the reasoning presented in the prose. This is mainly because it is
hard to say what the logical structure behind the prose actually is; there is
room for different interpretations. There is no such room in the case of the
argument visualization; there, the logical structure is entirely clear and
unambiguous, assuming one understands the conventions.
The
paradigmatic argument visualization is a visual display, much like the
familiar paper maps of towns, subway systems, treasure islands
etc. A more abstract approach would define an argument
visualization as any presentation of reasoning in which evidential structure is
made wholly explicit or unambiguous, whether by visual means or some other
approach. It ought to be possible to construct argument visualizations in which
the structure is conveyed explicitly through other sensory modalities. Blind
people, for example, might construct argument visualizations using chemistry
sets, where claims are encoded using Braille on the balls and then joined up
using sticks into argument structures. These could be unambiguously read by
people with appropriate skills. The key point is that, if the argument
visualization conventions are clear and appropriate, inferential or evidential
relations can be “read off” the presentation in a more or less mechanical way.
There is no need for sophisticated comprehension and reasoning skills in order
to figure out the structure of the reasoning (though understanding
and evaluating individual steps in the reasoning might take further
thought).
The
fairly minimal definition recommended here allows for enormous variety in
argument visualizations. The point of argument visualization is to present
complex reasoning in a clear and unambiguous way, and visualizers should use
whatever resources work best in achieving this goal. Currently, argument
visualizations are mostly “box and arrow” diagrams like the one above, but it
may turn out that some different approach will work more effectively. For
example, somebody may develop a clever way to present arguments in virtual 3D,
or even in immersive “virtual reality“ fly-through
environments. As long as the presentation makes the structure of reasoning
completely explicit and unambiguous, it will count as argument visualization.
5.3 Argument Visualization Versus Prose
Although prose is the standard way to present
reasoning, it is not a good tool for the job. Extracting the structure of
evidential relationships from reasoning as typically presented in prose is very
difficult and most of the time we do it badly. This can be easily
illustrated, in a kind of exercise we have done informally many times in
workshops. Take any group of people sufficiently trained in reasoning and
argument visualization that they are quite able to create argument
visualizations to make explicit whatever reasoning they have in mind. Now give
them a sample of good argumentative prose, such as a well-argued opinion
piece from the newspaper. Ask them to figure out what the reasoning is,
and to re-present it in an argument visualization.
This usually takes about 20-30 minutes, during which time you can enjoy
watching the participants strike various Rodinesque
postures of intense concentration, wipe their sweaty palms, etc. Then compare
the resulting argument visualizations. You'll find that you have as many
different argument visualizations as there are people doing the exercise; in
many cases the argument visualizations will be wildly different. This shows
that the opinion piece failed to reliably convey the author's argument,
whatever it was.
Argument
visualizations are deliberately designed to overcome precisely this problem
with prose. Exercises similar to the one just described show that they fulfill
their intended role. Take any group of people sufficiently trained to be
able to be read argument visualizations. (This training usually takes not more
than a few minutes.) Present them with an argument
visualization, and ask them to identify the reasoning presented in it, and
re-present it in whatever form they like (visualization, prose, point-form
etc.). This is a very simple task and usually takes almost no time; indeed, it
is so trivial that the hard part is getting the participants to go through the
motions when no intellectual challenge is involved. Ask them questions designed
to elicit the extent to which they have correctly identified the
structure of the reasoning presented by the visualization (e.g., how many
distinct reasons are presented for the main conclusion?). You'll find
that they all understand exactly what the reasoning is, and ipso facto all have
the same sense of the reasoning.
In
short, a task - identify the presented reasoning — which was difficult,
time-consuming and almost always fails in the standard prose format is easy,
fast and almost completely reliable in the argument visualization format. The
point here is really quite simple, although it often meets resistance.
Representations deliberately designed to communicate reasoning easily, rapidly
and reliably can achieve this goal. Representations not deliberately designed
for this purpose fail to achieve this goal. Who should be surprised?
Why
are argument visualizations so superior when it comes to presenting the
structure of reasoning? The short answer, just rehearsed, is that unlike prose,
they were designed to do the job well. More can be said, however. At
least four main factors explain the superiority of argument visualizations.
These points concern limitations of prose which are partly or wholly overcome
in argument visualizations.
Prose
Requires Interpretation
The most obvious problem with prose is that the
reader has to figure out what the relationships among the claims
are, using whatever clues (semantic, contextual, verbal) are offered by the
text. This is hard work, and because every reader has different skills,
background knowledge, etc., they will likely come up with different sets of
relationships, i.e., different interpretations of the reasoning. In an argument
diagram, by contrast, all relationships are made completely explicit using
simple visual conventions. Readers have to do very little work in order to see
how the claims are related (or, at least, how the claims are being presented
as related by the person who produced the diagram). In practice, this
removes a huge cognitive burden. Readers can then devote their mental energy to
thinking about the argument itself rather than trying to figure out what
the argument is.
Prose
Neglects Representational Resources
The second problem with prose is that it makes
use of an impoverished set of representational resources. It is just a
monochrome stream of words, sentences and paragraphs. It generally makes little
or no use of colour, shape, line or position in space
to convey information about the structure of the argument. Yet we know that the
brain can process large amounts of colour, shape line
and space information very rapidly. It makes little sense to ignore those
resources if they are available. In an argument diagram, for example, colour can be used to indicate in a matter of milliseconds
whether a claim is being presented as reason or an objection. In prose, the
reader has to interpret the claim and its context to figure out
its role in the argument. Helpful authors will assist readers in the difficult
process of interpretation by providing verbal cues (for example, logical indicators
such as “therefore”), although it is quite astonishing how frugal most authors
are in providing such cues.
Prose is
Sequential, Arguments are Not
A third deep problem with prose is its
sequential nature. Arguments are fundamentally not sequential. We take
them to he directed acyclic graphs (roughly, tree
structures), and others might claim that they are actually more complicated
than that, but one thing is clear: arguments, like grammatical structures, are
not just one thing after another. Prose, however, intrinsically imposes a
sequential structure: all the sentences presenting all the claims making up the
argument have to follow each other like carriages in a train. This means that
prose necessarily introduces inappropriate juxtapositions: in some places
claims which are not directly related in the reasoning must he concatenated in
the prose. Sure, you can use verbal indicators, paragraph breaks, section
breaks, etc., to help overcome the problem. But these are superficial or
stop-gap measures, and cannot eliminate the fact that the reader, in order to
understand the argument, must mentally reconstruct the non-sequential logical
structure from the sequential sentential structure of the prose. This point was
eloquently expressed by William Minto:
In writing you are as a commander filing out
his battalion through a narrow gap that allows only one man at a time to pass;
and your reader, as he receives the troops, has to reform and reconstruct them.
No matter how large or how involved the subject,..it
can be communicated only in that way. You see, then, what an obligation we owe
to him of order and arrangement - and why, apart from felicities and
curiosities of diction, the old rhetorician laid such stress upon order and
arrangement as duties we owe to those who honor us with their attention. (quoted in (Minto, 1995) p.178)
Minto was
wrong, however, in believing that one’s subject “can be communicated only in
that way.” Minto wrote this well before the arrival
of argument visualization as a feasible practice. These days, if one's subject
is a piece of reasoning, there is another way to communicate it, a way which
does not demand that the battalion file through the narrow gap. An argument
visualization presents the entire argument, all at once, in its proper order,
more like marching a battalion across a flat parade ground – and viewing it
from a helicopter!
Prose
Cannot Visually Display Metaphors
A fourth deep problem with prose is that it
makes no use, in the form of presentation, of the deep metaphors in terms of
which we naturally understand arguments. According to George Lakoff, human understanding essentially involves metaphors
grounded in our basic bodily experience (Lakoff,
1987). This general principle applies to understanding arguments as a special
case. It is no accident that so many of our metaphors for
reasoning and argument are basic ones of space, force, size: how much support
does the reason offer, what is the balance of considerations, how strong
is that objection, and so forth. Indeed, it is an interesting exercise to
try to describe fundamental aspects of reasoning, argument and evidence without
using such basic metaphors. Using diagrams, we can to some extent take
advantage of those mental schemas; e.g., we can place all the reasons over here
and all the objections over there, or we can make stronger reasons bigger, or
place them underneath (supporting) the conclusion, etc. None of this is
possible in standard prose; thus argument diagrams can tap directly into our
fundamental ways of understanding arguments in ways that prose cannot.[2]
5.4 New Tools for Argument
Visualization
The basic idea behind argument visualization is
remarkably simple. Everyone knows that good graphics are very effective for
presenting complex structures; that we are much better at visualizing
complexity than we are at cognising it.
Argument visualization just applies this basic insight to complex reasoning.
Yet
argument visualization has never really taken off as a practical tool for real
argumentation or deliberation. Why is this? No doubt there are many factors,
but one of the most important is surely that argument visualizations have not
been easy to produce. Given available tools, standard practices, and people’s
abilities, it has been much easier to write out one’s reasoning than to present
it in a map, at least for reasoning of any complexity.
Now,
however, we are seeing major changes in this regard. The arrival of the
personal computer and printer has opened up a whole new range of possibilities
for supporting thinking. A few decades ago, argument visualizations would have
to be sketched by hand, and producing serious visualizations would require
skilled draftsmen and highly specialised equipment.
This is no longer true; even quite ordinary computer users can use standard
desktop computers and inexpensive yet powerful software packages to create
complex visualizations with a quite professional appearance.
The
next major development will be tools designed specifically to support argument
visualization. Using generic packages is still too slow and cumbersome,
especially when major structural revisions to argument trees are needed.
Dedicated tools will support argument visualization in much the way that
PowerPoint effectively supports the process of producing overheads for a
presentation.
Some
first steps in this direction have already been taken. The primary function of
software packages such as Araucaria[3],‘
Athena (Rolf & Magnusson, 2002) and Reasonl!Able
(van Gelder & Bulka,
2000) is to support argument visualization. Using such software, one can now
assemble argument visualizations easily and rapidly; and for certain tasks,
such as reorganising reasoning, they can be superior
to prose.
Packages
in the current generation of argument visualization software are fairly basic,
and still have numerous usability problems. Soon however there will be much
more sophisticated packages designed from the outset to help people develop,
modify and distribute argument visualizations. Working with reasoning in
“argument visualization mode” will become easier than working in standard prose
mode. Since argument visualization expands our capacity to engage in reasoning,
such packages will be a major technological augmentation of our rational
capacities; arguably, they will constitute the first major advance in this area
in a very long time (Monk, 2001).
5.5 Enhancing Deliberation via
Argument Visualization
The main thesis of this chapter is that
argument visualization can substantially enhance deliberation. That is, we
deliberate better when we use argument visualization to lay out reasoning, as
compared with standard or traditional practice, which is to use prose. To
deliberate better is, in the end, to make better judgments as to what is true
and what is false. Such judgments can be better in two ways. First, they can be
better-founded; more systematic, more balanced, more objective. Second, they
can be more correct; they can better reflect the truth of the matter.
Presumably if they are better in the first sense they will be better in the
second.
The following sections provide two
examples of how using argument visualization can improve deliberation by
improving the quality of the reasoning which makes it up.
5.6 Argument Visualization in
Critical Thinking Training
Deliberation is usually done quite poorly. An
impressive piece of evidence in this regard is the study reported by
psychologist Deanna Kuhn in her book The Skill of Argument (Kuhn, 1991).
Kuhn and her team intensively interviewed hundreds of people, sampling from
many age groups, occupations, educational backgrounds, etc., with a view to
gauging their basic reasoning and argument skills. As l interpret the huge
amount of data she presents, she found that over half of the population simply
cannot reliably exhibit the basic skills needed in order to successfully
deliberate over important issues of any complexity. For example, she found that
while most people readily hold an opinion on an issue such as why many
criminals repeat their crimes, over half, when asked for evidence to support
that opinion, could not provide any at all. They would of course say a lot of
stuff in response to the request for evidence; the trouble is that what they
said wasn’t evidence (let alone good evidence).
A
natural response to this deplorable situation is to suggest that people ought
to be taught these basic skills; and if ordinary education doesn't
produce adequate general reasoning and argument skills, then there ought to be
special courses in how to do it. And in fact, there are such courses, although
not many people ever get to take one. Almost every university provides subjects
such as Introduction to Logic, or Critical Thinking, courses which are usually
advertised as worth taking because they improve general reasoning skills. But
is this true? Unfortunately there is not much evidence on the issue; only a
handful of studies have been conducted. The evidence we do have suggests that
such courses make little if any difference. Indeed, the gap between the
available evidence and the strong claims made on behalf of such courses
suggests that the philosophers and departments who offer such courses are
guilty of misleading advertising. It is especially ironic that teachers of
courses which focus on critically scrutinising
evidence have made so little effort to critically scrutinize the evidence for
their own claims.
Why
do standard courses on reasoning fail (if they do) to substantially improve
reasoning skills? I think there are three main explanations. First, they spend
a lot of time teaching irrelevant material. Techniques of elementary formal
logic, such as the theory of classical syllogisms and propositional logic, are
of little or no use in real-world reasoning. Eminent philosopher Y. Bar-Hillel
once said:
I am reasonably sure that humanity
spends more time on argumentation in natural languages than on the pursuit of
scientific knowledge. It is therefore of vital importance to get better
insights into the nature of argumentation in natural languages, and I challenge
anyone here to show me a serious piece of argumentation in natural languages
that has been successfully evaluated as to its validity with the help of formal
logic. I regard this fact as one of the greatest scandals of human existence.
The forum of equally eminent
philosophers to whom he said this was unable to meet the challenge (Bar-Hillel
& others, 1969).
Second,
reasoning is a skill, and skills generally improve through practice; however
standard courses take a “theory first” approach in which improved
performance is supposed to result from understanding the theory. Students spend
their time wrestling with the theory and don’t get nearly enough genuine
practice.
The
third explanation is most relevant to this chapter: insofar as such courses
deal with real reasoning and argumentation, they do so in the standard prose
format. This seems like an obvious and natural thing to do. As described above,
however, prose is a poor medium for presenting arguments, imposing heavy and
pointless cognitive burdens. Consequently, students’ attempts to grapple with
reasoning are confounded by the need to struggle with the prose presentation.
This creates spurious difficulties which impede development of general
reasoning and argument skills. If this is right, then students trained in
reasoning using argument mapping ought to improve more rapidly than students in
traditional courses.
The
Reason! Project at the University of Melbourne has taken this approach. From
the outset the goal was to develop a superior method for enhancing critical
thinking, focusing on reasoning and argument skills. Its guiding inspiration
has been what we call the Quality Practice Hypothesis, the claim that critical
thinking skills improve through extensive amounts of the right kind of
practice. The challenge is to set up a situation in which students will in fact
do large amounts of such practice. As part of meeting this challenge we
developed the Reason!Able
software, which is a “quality practice environment" — a place where
students can engage in reasoning tasks more effectively than in traditional
contexts. The most important feature of Reason!Able in this regard is that it is very largely a
matter of argument visualization; everything the students do with it takes
place in that mode. The software supports rapid and easy construction,
modification and evaluation of argument visualizations (Figure 5.1).
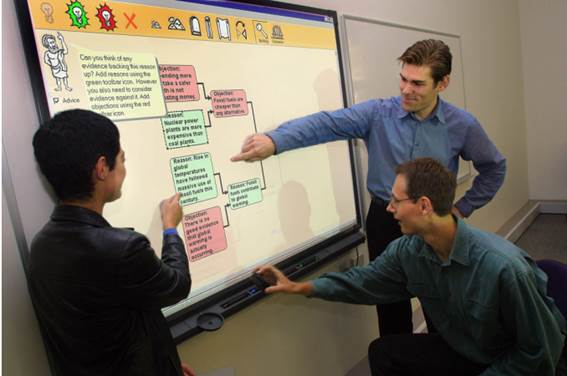
Figure 5.1: Argument visualization using the
Reason!Able software. The
software supports rapid and easy construction, modification and evaluation of
argument visualizations. The process helps translate abstract logical
complexity into simple, colourful diagrams. Wlien used with a touch-sensitive screen such as the SMART
Board pictured above, the argument visualizations become manipulable
in a very direct sense. Photo: Michael Silver.
The
Reason! method for enhancing critical thinking
consists of students working through a large number of Reason!Able-based
exercises. The efficacy of the approach has been intensively evaluated. Every time we run the one-semester subject, we pre- and
post-test students using a number of different tests. On the California
Critical Thinking Skills Test (CCTST'), arguably the best available objective
(multi-choice) test of critical thinking, students as a group reliably improve
with an effect size of about 0,83 of standard deviation[4] (van Gelder, 2001). By this measure, a Reason!-based course is
many times as effective as traditional critical thinking courses. To get a
rough idea of the scale of improvement here, consider that an equivalent gain
in IQ would be about 12 points in l2 weeks. Or, for another perspective,
consider that the expected gain in critical thinking skills in the course of an
undergraduate education, based on a wide variety of studies, is about 0.5 of a
standard deviation.[5]
Twelve weeks of training based on argument visualization improves reasoning
skills, as measured by the CCTST, by an amount substantially in excess of the
expected gain while at college.
For
two years running we have also pre- and post-tested the same students using a
written test of our own devising, requiring students to read some argumentative
prose and to critically evaluate the reasoning. We had their written responses
blindly scored by two critical thinking experts who are quite independent of
our team. Although there was much more variation in scores, the overall
magnitude of the gain was approximately equivalent to that found using the
CCTST (van Gelder, 2001). This indicates that
although the training was based on argument visualization, the students were
improving their ability to handle reasoning in standard prose formats. In other
words, the training effects transferred from the training tasks to other tasks
in a more standard format.
How
do we know that the improvement was due to argument visualization rather than
to some other feature of the course? Perhaps the real causal factor was the
large amounts of practice rather than the argument visualization medium.
Indeed, we had designed the approach on the hypothesis that large
amounts of quality practice is the key to improving skills. In order to
test that hypothesis, we built mechanisms to log every move students made with
the software over an entire semester. This data yielded crude measures of the
total amount of time students spent using the software and the total amount of activity. We have also
used questionnaires to interrogate the students as to their practice regimes.
We took these figures as estimates of the amount of practice in reasoning
they were actually doing. The Quality Practice Hypothesis predicted that there
should be a correlation between practice and improvement. Much to our surprise and
consternation, we have so far found virtually no correlation between the two.
This
suggests that something else is the key difference between the Reason! approach and traditional
approaches. Our hunch at this stage is that it is argument visualization.
Exercises conducted in the argument visualization format give students a strong
visual sense of the structure of reasoning and argument. Once this sense is
acquired, further practice makes relatively little difference. If this is
right, argument visualization is inducing a qualitative shift in students’
abilities. Using the software, which translates complex arguments into simple, colourful and manipulable
structures, students “click” as to how reasoning works. At this stage, however,
this conjecture is untested. Our investigations in this area are still quite
preliminary, and further studies are underway.
All
this does not prove that argument mapping enhances deliberation per se. It is
fairly convincing evidence that argument visualization substantially improves
general reasoning and argument skills, and since deliberation is a matter of
exercising those skills, it is plausible that deliberation would be improved.
5.6.1 Argument Visualization in
Group Deliberation
Improving individuals’ deliberative capacities
is fine, but deliberation is often done in group contexts, especially when
issues get really complex and important. Can computer supported argument
visualization enhance group deliberation also?
Austhink has become increasingly involved in using realtime argument visualization to help groups deliberate
about issues involving lots of complex arguments. The situations are quite
varied, and so it is difficult to encompass the activity in a compact and
comprehensive way. Rather, I will describe in detail one more-or-less typical
example, and allow general considerations to emerge in that context.
A
factory in Sydney producing domestic cleaning products had, a number of years
previously, made a switch from their traditional “one person one job” (OPOJ)
mode of operation to a multi-skilling mode in which each person was trained in,
and rotated through, a number of different tasks. The change had been mandated
from on high, and had produced a certain amount of discontent in the ranks.
Over the following years there had been considerable grumbling and dispute,
involving the multi-skilled workers themselves, supervisors, and human resource
managers. These people of course brought quite different perspectives,
interests, and educational backgrounds to the debate. No matter how much
discussion took place, on the factory floor or in meetings, in small groups or
large, little progress was made; arguments seemed to just go around in circles,
and disagreement seemed only to become more entrenched. For every point somebody
made there seemed to be a counterpoint, and in the thickets of disputation,
everyone could find a way to hold onto their own opinion.
A
human resources manager hoped to achieve some kind of rational resolution by
bringing in some more effective way of handling the disagreement. The standard,
prose-based methods just weren't working. Having read a newspaper piece about
argument visualization, she decided to give it a go. Her goal was not to prove
that any one perspective was right to the exclusion of all others. Rather, it
was to try to lay out all the arguments so that everyone could better see how
complex the issues were and that opponents were usually making at least some
valid points. Ideally, from her point of view, the process would result in a solid
consensus that some kind of middle road between OPOJ and complete
multi-skilling was going to be best both for individuals and for the factory as
a whole.
One
morning, we gathered in a meeting room. Participants included workers (some of
whom had just finished night shift) and managers, as well as one argument
visualization facilitator. The facilitator brought along a laptop computer with
visualization software loaded, as well as some introductory materials,
including a few sample argument visualizations so participants could see
roughly where the process was headed. A data projector and screen were set up,
the laptop plugged in, and chairs set up in an arc close to the screen. There
were approximately 20 participants, which is a good number for this kind of
exercise; larger numbers mean that each person has less chance to be actively
involved, which can lead to boredom and disengagement.
In
what follows, the process we followed has been divided, somewhat
artificially, into a series of distinct stages:
Stage 1:
Introduce Argument Visualization
The first stage was a brief introduction
to argument visualization. Usually, participants have never seen or even heard
of the technique, but are able to understand what is going on pretty quickly.
The “box and arrow” structure of an argument
visualization seems to tap directly into an intuitive or metaphorical sense
they already have that an argument is made up of “this piece over here and that
piece over there”. In the introduction, we spend more time explaining why you
might want to use the technique than explaining how it works.
Stage 2:
Identify the Central Proposition
Since argument visualization supports
deliberation, and deliberation is aimed at determining the truth or falsity of
a particular proposition, we next tried to figure out what that proposition
should be. This involves a free-flowing discussion of the overall issue, and
(non-visualized) debate over the merits of various candidates. Candidates are
written in boxes on the screen so that everyone can see and compare without
having to a hold them in memory. This stage is critical to the success of the
enterprise. Participants must accept the central proposition as being at the
very heart of their disagreement, such that reaching some kind of consensus on that
contention would constitute real progress. From a logical point of view, it
should be clear, simple, specific, and an obvious target for the main
arguments. In this case, we ended up with “The factory should return to one
person one job,” although in retrospect this was probably not the best one we
could have used. Often you can only really tell how adequate the central
proposition is after quite a bit of argument visualization.
Stage 3:
Canvass the Arguments
In the third stage, we canvassed the arguments
for and against, secondary arguments, etc. This is, loosely speaking,
a matter of “brainstorming”; the idea is to get all the considerations which
matter to any participant out and onto the visualization. As arguments are
raised, new nodes are added to the argument tree and the sentences expressing
the arguments typed into the nodes. With a skilled facilitator, this does not
slow the flow of thought very much.
In
this case, we followed standard practice and started by attempting to list all
the major reasons which seemed to provide direct evidence for the proposition,
such as “One person for one job is a simpler system to manage.” However
visualization usually proceeds in a “depth first” rather than a “breadth
first” manner. That is, as soon as a reason is raised, those on the other
side weigh in with objections or counterarguments, to which there are further
responses, etc. (Figure 5.2).
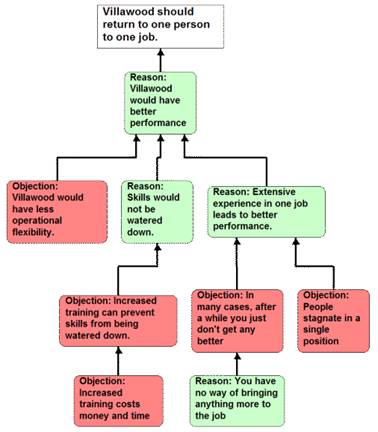
Figure 5.2: A small part of the argument
tree-in-progress in Reason!Able
format, much as it would have appeared to participants during the workshop. A
cluster of argumentation hears upon a single primary reason to helieve the main conclusion. This illustrates “depth
first" elaboration of the arguments. “Villawood”
is the name used to refer to the factory, based on the neighbourhood
where it is located.
In order to help maintain a sense of the
natural flow of the arguments, it is important to visualize these - to
give them a definite place in the emerging argument tree — as they arise,
rather than asking people to hold their point for later, when it may have been
lost.
As
the argument tree gets more complex, it becomes increasingly apparent that the
process is not a matter of orderly accumulation of successive points. Rather,
much time and thought must he given to reworking the
existing tree. Claims which previously seemed OK have to he
reformulated so that they are more precise, express the right nuances, or are
more clearly distinct from other claims. Particular arguments, or even whole
lines of argument may need to he relocated to another
position on the tree. This is one place where good argument visualization
software really proves its worth; indeed, real-time argument visualization
would he practically impossible without such a tool.
Once
all the primary reasons (with their supporting reasons, objections, and so
forth) had been laid out, we turned to the primary objections. Work here
usually goes a bit more smoothly than with the supporting reasons. This may be
surprising, since objections arc cognitively more demanding than reasons, and objections to objections (rebuttals) are far
more demanding than objections to reasons. By this stage, however, participants
are more experienced and comfortable with the process, and they start to
pre-package their contribution so it can be entered directly onto the argument
visualization. Also, many of the considerations relevant on the “con” side had
already
arisen in
some form as the “pro” side had been elaborated, and so are better understood
by this stage. (Such considerations can prompt a certain amount of effort
reworking the tree so as to obtain the most elegant and conceptually satisfying
structure for the overall argument.)
Periodically,
the argument visualization was printed out, and copies were distributed to the
participants. Although the projected image on the screen was large, it had a
low resolution, and as the tree became more elaborate, we were faced with a
choice — either the whole visualization was displayed, in which case the
overall structure could be seen but the text of individual nodes was illegible,
or we zoomed in to focus on particular parts of the tree, but the overall
context was lost. A paper printout is much higher resolution, and although the
writing is very small all the nodes can be read. (Of course, beyond a certain
level of complexity, typical A4 printouts are illegible as well.)
The
“canvassing” stage took about three hours. By that time participants were
flagging due to the sustained effort involved. More importantly, they had run
out of substantial new points; it seemed like most of the relevant arguments
had been made. This is normal. In our experience, as a rule of thumb, roughly
half a day suffices to extract all the significant arguments that a group of
people can think of on any given issue, even when the issue is of some concern
to them. This may be an interesting empirical fact about the level of
complexity of typical debates. Of course there are
contexts where people command argument
structures which would take far more than half a day to lay out, and others
where the known arguments can be elaborated in far less time. But under
ordinary circumstances, participants in debates have available to them
collectively a stock of a few score moves, and these can be visualized in a
matter of hours.
Success
in this third phase depends heavily on the skills of the facilitator. Of course
he must have the standard repertoire expected of anyone facilitating group
discussion. Beyond that, the argument visualization guide must be able to take
the raw verbal material and rapidly massage it into a coherent argumentative
structure. This means taking what a participant is saying and reformulating it
in some text which is recognized by the participant as expressing her point,
captures the essential underlying logic, and plugs appropriately into the
existing argument tree. The participants have lots of “domain knowledge",
but are often less able to translate that knowledge into coherent logical
structures. The skilled facilitator knows little about the topic but is able to
repackage contributions so that the participants feel that it is their
arguments which are appearing on the tree. If the facilitator is a “one man
show” and is also creating the visual map on the computer, he must be competent
in using the visualization software and typing entries, and moving rapidly and
easily back and forth between group facilitation and computer use. Many very
able people would not be effective solo argument visualization facilitators
because they are just too slow with the computer.
Stage 4:
Review Arguments Seeking Rational Consensus
The aim of the whole exercise, remember, was to
promote rational consensus on the main issue. The next stage, then, was to
review the arguments as presented on the visualization and to see what this
implied for the proposition that the factory should return to OPOJ. By this
time however, something remarkable had already happened. As the negative case
was being visualized, one argument emerged as conclusively establishing that
the proposition was false. In a nutshell, it was that when each person is
dedicated to a single task, if the one person responsible for a given task is
sick or otherwise unable or unwilling to do their job, it can jeopardize the
whole manufacturing process. We wrestled with this objection for a quite a
while, trying to think of ways to soften its impact. Various suggestions were
made, but none were convincing; this point was the knockdown argument for
multi-skilling.
The
remarkable part of this is not that this objection came to light, or that it
was perceived as a strong one. ln
fact the point is pretty obvious and has always been a primary rationale for
multi-skilling in the workplace. The remarkable part was that when this
objection was laid out clearly in the context of all other relevant
considerations, its overriding force was fully appreciated in a way it had
never been when the arguments were rehearsed in standard ways. Opponents of
multi-skilling had previously been familiar with this objection, but must have
felt that they had adequate responses to it. Yet when the objection and the
responses were laid out clearly for all to see, the strength of the objection
and relative frailty of any counterarguments became unavoidably apparent.
Thus
in the consensus phase there was little more to be said; the rational consensus
among the group was that some degree of multi-skilling was essential, and that
all objections to multi-skilling were so many hurdles or barriers to be
overcome rather than a overriding case for a return to
the had old ways. There may continue to be grumbling and resentment, but
whether the factory should continue to promote multi-skilling was no longer a
topic for serious dispute.
Stage 5:
Print and Display Visualization
By this time, participants had been viewing the
projected argument visualization on the large screen, and had seen A4 printouts
of drafts. As they walked out of the room, the complexity and arrangement of
the full set of arguments would have to be held in their heads if it was to be
retained at all. Yet we have very limited capacity to remember and to process
complex structures of reasoning with our unaided brains. Even taking notes, in
the traditional sense, wouldn't help much; the notes would probably not capture
all the details, and in any case the note taker would have to mentally
reconstruct the overall structure of the argumentation from the notes. The
output of the visualization process - he argument
visualization - would have to be somehow made available to participants for
review at later times.
Thus
the final stage of the argument visualization exercise was producing a
high-quality, poster-sized, colourful printed map of
the entire set of arguments, for display in some prominent place in the
factory. We took the final draft of the visualization away in electronic
form, reworked the argument to clean it up, both within nodes and in its
overall structure; then sent it off to be printed in
A1 size (Figure 5.3).
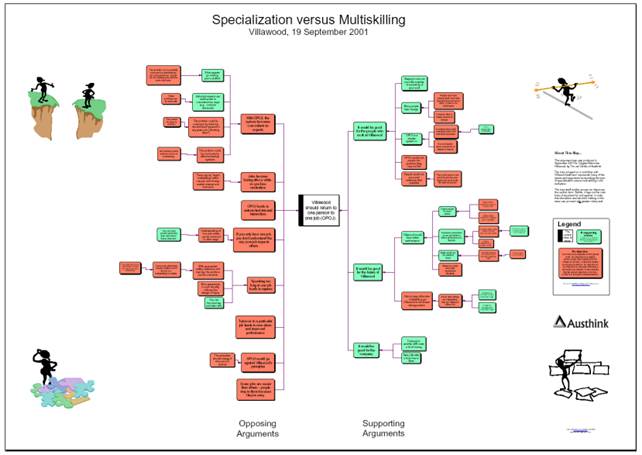
Figure 5.3: The revised argument visualization.
This was printed in Al size, laminated, and sent back to the workplace so that
participants and others could easily review the arguments. Notice that even
though the individual claims (text within nodes) are illegible, the main
structure of the argument is clearly visible at a glance. For example, it is
apparent that there is a larger number of primary
objections (nodes immediately to the left of the central node) than primary
reasons.
This poster was then laminated and sent back to
the factory, where it was, at least for a while, pinned up on a public wall so
that anyone could read it, review the arguments, and perhaps use it to help
them rationally determine their opinion on the matter.
To return to the main theme of this chapter,
how did computer supported argument visualization enhance group deliberation?
- Most
profoundly, the live argument visualization process expanded participants’
sense of the full set of arguments, and where individual arguments
belonged in the overall structure. They could, literally, see what was
going on, in a way not possible with standard prose-based ways of handling
reasoning; and, having seen the full argument, were better able to take
relevant factors into account.
- The
evolving, projected argument visualization gave participants a common
understanding of the arguments and their structure. In ordinary
argumentative practices, people must maintain in their minds a sense of
what the overall argument is. Since this is exceedingly difficult to do,
they end up with partial versions and everyone has a somewhat different
interpretation. When everyone is on a different wavelength, there is a
great deal of confusion, needless disputation, and wasted time.
- The
argument visualization process gave participants a powerful sense that
they had been heard, that their opinion had been registered. When
they made a contribution to the overall debate, it was entered in a box
and placed on the tree, and it stayed there for all to see for the
duration of the workshop; and if it had not been responded to, this was
immediately apparent in the visual layout of the argument tree.
- The
argument visualization process smoothed the path to rational consensus by depersonalizing
disagreement. In standard meetings or round-table discussions, positions
tend to he identified with people, and
debate becomes a personal contest as much as an objective considering of
the arguments. When all attention is focused on the argument tree,
however, personalities drop away and people are much better able to
appreciate the force of the arguments, and to see gaps and weaknesses.
- The
poster-sized argument visualization is now a permanent part of that
particular organisation’s memory. On one day,
the participants had achieved what was probably their highest ever level
of awareness and understanding of the arguments on a topic of considerable
internal importance. If they were to rely unaided
memory to store this "knowledge," or even had it written up and
filed away in some kind of report, it would surely have been lost. The
argument visualization both encodes that knowledge and makes it readily
recoverable for anyone in future.
5.7 Conclusion
Deliberation is the primary means by which we
strive for, and sometimes actually find, the truth on important, complex
issues. Anything which enhances deliberation thereby enhances our ability to
know the truth. Argument visualization can substantially enhance deliberation,
relative to traditional practices. The emergence of new, dedicated argument
visualization support tools will, I believe, enable argument visualization to
become widespread practice in schools, and in the workplace, in domains as
various as policy making, research, politics, the law, and dispute resolution.
If all this is correct, computer supported argument visualization ought, in the
long run, contribute substantially to human well-being. In this sense, our
project is a extension of
the Enlightenment vision of progress through the refinement and application of
Reason.
5.8 References
Bar-Hillel, Y., & others. (1969). Formal logic and natural languages: A
symposium. Foundations of Language, 5, 256-284.
Dyson, F.
J. (2002, March 28). Science and religion: No ends in sight. The
New York Review of Books. Retrieved on August 28, 2002 from http://www.nybooks.com/articles/15220
Kuhn, D.
(1991). The Skills of Argument. Cambridge, Eng; Cambridge University
Press.
Lakoff,
G. (1987). Women, fire, and dangerous things: what categories reveal about
the mind. Chicago: University of Chicago Press.
Minto, B.
(1995). The pyramid principle: Logic in writing and thinking. Edinburgh
Gate:
Pearson education.
Monk, P.
(2001, March 16). Mapping the future of argument.
Australian Financial Review,
(pp. 8-9).
Pascarella, E. T., & Terenzini, P. T. (1991). How college affects students: Findings and
insights from twenty years of research. San Francisco: Jossey-Bass.
Rolf, B., & Magnusson, C. (2002). Developing the art of
argumentation. A software approach. Paper
presented at the 5th International Conference on Argumentation, University of
Amsterdam.
Van Eemeren, F. H., Grootendorst, R.,
Henkemans, F. S., Blair, J. A., Johnson, R. H., Krabbe, E. C. W., at al. (I996). Fundamentals of
argumentation theory: A handbook of historical backgrounds and contemporary developments.
Mahwah, N.J.: Lawrence Erlbaum Associates.
Van Gelder, T. J. (2001). How to improve
critical thinking using educational technology. In G. Kennedy, M. Keppell, C. McNaught & T. Petrovic (Eds), Meeting at the
crossroads: proceedings of the 18th annual conference of the
Australasian Society for computers in learning in tertiary education (pp.
539-548). Melbourne: Biomedical Multimedia Uni, The University of Melbourne.
Van Gelder, T. & Bulka, A. (2000). Reason!Able (Version 1.1).
Melbourne: The Reason Group. Available from http://www.goreason.com
Webster, N., & Porter, N. (1913). Webster's revised unabridged dictionary of
the English Language. Springfield, MA: G. & C. Merriam company.